Tuesday, 22 December 2020

Obesity impairs immune cell function, accelerates tumor growth

Cancer definition

Obesity has been linked to increased risk for over a dozen different types of cancer, as well as worse prognosis and survival. Over the years, scientists have identified obesity-related processes that drive tumor growth, such as metabolic changes and chronic inflammation, but a detailed understanding of the interplay between obesity and cancer has remained elusive.

Now, in a study in mice, Harvard Medical School researchers have uncovered a new piece of this puzzle, with surprising implications for cancer immunotherapy: Obesity allows cancer cells to outcompete tumor-killing immune cells in a battle for fuel.

Reporting in Cell on Dec. 9, the research team shows that a high-fat diet reduces the numbers and antitumor activity of CD8+ T cells, a critical type of immune cell, inside tumors. This occurs because cancer cells reprogram their metabolism in response to increased fat availability to better gobble up energy-rich fat molecules, depriving T cells of fuel and accelerating tumor growth.

"Putting the same tumor in obese and nonobese settings reveals that cancer cells rewire their metabolism in response to a high fat diet," said Marcia Haigis, professor of cell biology in the Blavatnik Institute at HMS and co-senior author of the study. "This finding suggests that a therapy that would potentially work in one setting might not be as effective in another, which needs to be better understood given the obesity epidemic in our society."

The team found that blocking this fat-related metabolic reprogramming significantly reduced tumor volume in mice on high-fat diets. Because CD8+ T cells are the main weapon used by immunotherapies that activate the immune system against cancer, the study results suggest new strategies for improving such therapies.

"Cancer immunotherapies are making an enormous impact on patients' lives, but they do not benefit everyone," said co-senior author Arlene Sharpe, the HMS George Fabyan Professor of Comparative Pathology and chair of the Department of Immunology in the Blavatnik Institute.

"We now know there is a metabolic tug-of-war between T cells and tumor cells that changes with obesity," Sharpe said. "Our study provides a roadmap to explore this interplay, which can help us to start thinking about cancer immunotherapies and combination therapies in new ways."

Haigis, Sharpe and colleagues investigated the effects of obesity on mouse models of different types of cancer, including colorectal, breast, melanoma and lung. Led by study co-first authors Alison Ringel and Jefte Drijvers, the team gave mice normal or high-fat diets, the latter leading to increased body weight and other obesity-related changes. They then looked at different cell types and molecules inside and around tumors, together called the tumor microenvironment.

Researchers develop rapid genomics strategy to trace coronavirus


Coronavirus illustration

Thanks to cutting-edge 'Nanopore' genome sequencing technology, researchers at the Garvan Institute of Medical Research and the Kirby Institute at UNSW Sydney have developed the most rapid coronavirus genome sequencing strategy in Australia to date. The technological advance has the potential to provide critical, timely clues on how cases of SARS-CoV-2 infection are linked.

The researchers today published an analytical validation and best practice guidelines for Nanopore sequencing of SARS-CoV-2 in Nature Communications, which they hope will enable a greater uptake of the fast sequencing technology for health initiatives in Australia and overseas.

"Every time the SARS-CoV-2 virus passes from person to person, it may make copying errors that change a couple of its 30,000 genetic letters. By identifying this genetic variation, we can establish how different cases of coronavirus are linked -- to know where a case was potentially picked up from and who they may have given it to," says co-first author A/Prof Rowena Bull, from UNSW's Kirby Institute.

A/Prof Bull says genomic testing is crucial for tracking virus transmission in cases where the source remains unclear from investigating known epidemiological contacts alone.

"By reconstructing the virus's evolutionary history, or 'family tree', we can understand the behaviours that help spread COVID-19 and identify so-called 'super-spreaders'," she says.

"When a new 'mystery' coronavirus case is identified, every minute counts. At Garvan, we have repurposed our genomic sequencing capabilities to enable a rapid analysis of a coronavirus genome in just a few hours," says senior author Dr Ira Deveson, Head of the Genomic Technologies Group at Garvan's Kinghorn Centre for Clinical Genomics.

"We've been thrilled to collaborate with the Garvan and Kirby Institutes to develop unparalleled speeds of coronavirus genome testing. Rapid methods such as this provide a way forward, as a potential future option for contact tracing through real time genomic transmission studies," says Prof Bill Rawlinson AM, from UNSW Sydney and NSW Health Pathology Randwick.

"This technical advance is a testament to what's possible when public pathology collaborates with Research Institutes for a common goal," says Prof Sebastiaan van Hal, from NSW Health Pathology -- Royal Prince Alfred Hospital.

Pioneering rapid genomics

Pinpointing SARS-CoV-2 transmission quickly is crucial. NSW Health Pathology has collaborated with the Garvan Institute and Kirby Institute to develop faster SARS-CoV-2 genome sequencing capabilities, potentially enhancing the ability of contact tracers to take rapid action to quarantine and monitor potential contacts. Garvan researchers have fine-tuned the protocols for cutting-edge Oxford Nanopore Technologies to sequence SARS-CoV-2 in less than four hours. Garvan's Kinghorn Centre for Clinical Genomics is the first facility in Australia to establish and apply this Nanopore technology for genomic surveillance of SARS-CoV-2.

Highly accurate emerging technologies

The current gold-standard method reads short genetic sequences of just 100-150 genetic letters at a time, whereas Nanopore technologies have no upper limit to the length of DNA fragments that can be sequenced and are able to more rapidly determine the complete sequence of a viral genome.

"However, as with many emerging technologies, there have been concerns about the accuracy of Nanopore sequencing. We addressed these concerns in our paper where we report the outcomes of a rigorous analytical evaluation of our protocols for sequencing the coronavirus genome," says Dr Deveson.

The researchers' analysis revealed the Nanopore sequencing method to be highly accurate (variants were detected with >99% sensitivity and >99% precision in 157 SARS-CoV-2-positive patient specimens) and provides best practice guidelines, which the researchers hope will promote the uptake of the technology by other teams globally.

The researchers say Nanopore sequencing even has the potential to enhance SARS-CoV-2 surveillance by enabling point-of-care sequencing and improved turnaround times for critical cases.

"Nanopore devices are cheaper, faster, portable and don't require the lab infrastructure needed by current standard pathogen genomics tools," says Dr Deveson. "We hope our validation of this protocol will help other public health teams around the world adopt this technology."


Plastics pose threat to human health, report shows

Bulldozer at landfill

Plastics contain and leach hazardous chemicals, including endocrine-disrupting chemicals (EDCs) that threaten human health. An authoritative new report, "Plastics, EDCs, and Health," from the Endocrine Society and the IPEN (International Pollutants Elimination Network), presents a summary of international research on the health impacts of EDCs and describes the alarming health effects of widespread contamination from EDCs in plastics.

EDCs are chemicals that disturb the body's hormone systems and can cause cancer, diabetes, reproductive disorders, and neurological impairments of developing fetuses and children. The report describes a wealth of evidence supporting direct cause-and-effect links between the toxic chemical additives in plastics and specific health impacts to the endocrine system.

Conservative estimates point to more than a thousand manufactured chemicals in use today that are EDCs. Known EDCs that leach from plastics and threaten health include bisphenol A and related chemicals, flame retardants, phthalates, per- and polyfluoroalkyl substances (PFAS), dioxins, UV-stabilizers, and toxic metals such as lead and cadmium. Plastic containing EDCs is used extensively in packaging, construction, flooring, food production and packaging, cookware, health care, children's toys, leisure goods, furniture, home electronics, textiles, automobiles and cosmetics.

Key findings in the report include:

  • One hundred and forty four chemicals or chemical groups known to be hazardous to human health are actively used in plastics for functions varying from antimicrobial activity to colorants, flame retardants, solvents, UV-stabilizers, and plasticizers.
  • Exposure can occur during the entire life span of plastic products, from the manufacturing process to consumer contact, recycling, to waste management and disposal.
  • EDC exposure is a universal problem. Testing of human samples consistently shows nearly all people have EDCs in their bodies.
  • Microplastics contain chemical additives, which can leach out of the microplastic and expose the population. They can also bind and accumulate toxic chemicals from the surrounding environment, such as seawater and sediment, functioning as carriers for toxic compounds.
  • Bioplastics/biodegradable plastics, promoted as more ecological than plastics, contain similar chemical additives as conventional plastics and also have endocrine-disrupting effects.

"Many of the plastics we use every day at home and work are exposing us to a harmful cocktail of endocrine-disrupting chemicals," said the report's lead author, Jodi Flaws, Ph.D., of the University of Illinois at Urbana-Champaign in Urbana, Ill. "Definitive action is needed on a global level to protect human health and our environment from these threats."

The Swiss Ambassador for the Environment, Franz Xavier Perrez, commented, "'Plastics, EDCs, and Health,' synthesizes the science on EDCs and plastics. It is our collective responsibility to enact public policies to address the clear evidence that EDC in plastics are hazards threatening public health and our future."

In May, the Swiss Government submitted a proposal to the Stockholm Convention to list the first ultra-violet (UV) stabilizer, plastic additive UV-328, for listing under the Stockholm Convention. UV stabilizers are a common additive to plastics and are a subset of EDCs described in this report. The Stockholm Convention is the definitive global instrument for assessing, identifying, and controlling the most hazardous chemical substances on the planet.

The need for effective public policy to protect public health from EDCs in plastics is all the more urgent given the industry's dramatic growth projections. Pamela Miller, IPEN Co-Chair, commented, "This report clarifies that the current acceleration of plastic production, projected to increase by 30-36% in the next six years, will greatly exacerbate EDC exposures and rising global rates of endocrine diseases. Global policies to reduce and eliminate EDCs from plastic and reduce exposures from plastic recycling, plastic waste, and incineration are imperative. EDCs in plastics are an international health issue that is felt acutely in the global south where toxic plastic waste shipments from wealthier countries inundate communities."

"Endocrine-disrupting chemical exposure is not only a global problem today, but it poses a serious threat to future generations," said co-author Pauliina Damdimopoulou, Ph.D., of the Karolinska Institutet in Stockholm, Sweden. "When a pregnant woman is exposed, EDCs can affect the health of her child and eventual grandchildren. Animal studies show EDCs can cause DNA modifications that have repercussions across multiple generations."


COVID-19 virus enters the brain, research strongly suggests

Coronavirus illustration 

More and more evidence is coming out that people with COVID-19 are suffering from cognitive effects, such as brain fog and fatigue.

And researchers are discovering why. The SARS-CoV-2 virus, like many viruses before it, is bad news for the brain. In a study published Dec.16 in Nature Neuroscience, researchers found that the spike protein, often depicted as the red arms of the virus, can cross the blood-brain barrier in mice.

This strongly suggests that SARS-CoV-2, the cause of COVID-19, can enter the brain.

The spike protein, often called the S1 protein, dictates which cells the virus can enter. Usually, the virus does the same thing as its binding protein, said corresponding author William A. Banks, a professor of medicine at the University of Washington School of Medicine and a Puget Sound Veterans Affairs Healthcare System physician and researcher. Banks said binding proteins like S1 usually by themselves cause damage as they detach from the virus and cause inflammation.

"The S1 protein likely causes the brain to release cytokines and inflammatory products," he said.

In science circles, the intense inflammation caused by the COVID-19 infection is called a cytokine storm. The immune system, upon seeing the virus and its proteins, overreacts in its attempt to kill the invading virus. The infected person is left with brain fog, fatigue and other cognitive issues.

Banks and his team saw this reaction with the HIV virus and wanted to see if the same was happening with SARS CoV-2.

Banks said the S1 protein in SARS-CoV2 and the gp 120 protein in HIV-1 function similarly. They are glycoproteins -- proteins that have a lot of sugars on them, hallmarks of proteins that bind to other receptors. Both these proteins function as the arms and hand for their viruses by grabbing onto other receptors. Both cross the blood-brain barrier and S1, like gp120, is likely toxic to brain tissues.

"It was like déjà vu," said Banks, who has done extensive work on HIV-1, gp120, and the blood-brain barrier.

The Banks' lab studies the blood-brain barrier in Alzheimer's, obesity, diabetes, and HIV. But they put their work on hold and all 15 people in the lab started their experiments on the S1 protein in April. They enlisted long-time collaborator Jacob Raber, a professor in the departments of Behavioral Neuroscience, Neurology, and Radiation Medicine, and his teams at Oregon Health & Science University.

The study could explain many of the complications from COVID-19.

"We know that when you have the COVID infection you have trouble breathing and that's because there's infection in your lung, but an additional explanation is that the virus enters the respiratory centers of the brain and causes problems there as well," said Banks.

Raber said in their experiments transport of S1 was faster in the olfactory bulb and kidney of males than females. This observation might relate to the increased susceptibility of men to more severe COVID-19 outcomes.

As for people taking the virus lightly, Banks has a message:

"You do not want to mess with this virus," he said. "Many of the effects that the COVID virus has could be accentuated or perpetuated or even caused by virus getting in the brain and those effects could last for a very long time."

This study was partially supported by a National Institute on Aging-funded COVID-19 supplement to a shared RF1 grant of Banks and Raber.


Thursday, 8 October 2020

Comet discovered to have its own northern lights

This composite is a mosaic comprising four individual NAVCAM images taken from 19 miles (31 kilometers) from the center of comet 67P/Churyumov-Gerasimenko on Nov. 20, 2014. The image resolution is 10 feet (3 meters) per pixel.

Data from NASA instruments aboard the ESA (European Space Agency) Rosetta mission have helped reveal that comet 67P/Churyumov-Gerasimenko has its own far-ultraviolet aurora. It is the first time such electromagnetic emissions in the far-ultraviolet have been documented on a celestial object other than a planet or moon. A paper on the findings was released today in the journal Nature Astronomy.

On Earth, aurora (also known as the northern or southern lights) are generated when electrically charged particles speeding from the Sun hit the upper atmosphere to create colorful shimmers of green, white, and red. Elsewhere in the solar system, Jupiter and some of its moons -- as well as Saturn, Uranus, Neptune, and even Mars -- have all exhibited their own version of northern lights. But the phenomena had yet to be documented in comets.

Rosetta is space exploration's most traveled and accomplished comet hunter. Launched in 2004, it orbited comet 67P/Churyumov-Gerasimenko (67P/C-G) from Aug. 2014 until its dramatic end-of-mission comet landing in Sept. 2016. The data for this most recent study is on what mission scientists initially interpreted as "dayglow," a process caused by photons of light interacting with the envelope of gas -- known as the coma -- that radiates from, and surrounds, the comet's nucleus. But new analysis of the data paints a very different picture.

"The glow surrounding 67P/C-G is one of a kind," said Marina Galand of Imperial College London and lead author of the study. "By linking data from numerous Rosetta instruments, we were able to get a better picture of what was going on. This enabled us to unambiguously identify how 67P/C-G's ultraviolet atomic emissions form."

The data indicate 67P/C-G's emissions are actually auroral in nature. Electrons streaming out in the solar wind -- the stream of charged particles flowing out from the Sun -- interact with the gas in the comet's coma, breaking apart water and other molecules. The resulting atoms give off a distinctive far-ultraviolet light. Invisible to the naked eye, far-ultraviolet has the shortest wavelengths of radiation in the ultraviolet spectrum.

Exploring the emission of 67P/C-G will enable scientists to learn how the particles in the solar wind change over time, something that is crucial for understanding space weather throughout the solar system. By providing better information on how the Sun's radiation affects the space environment they must travel through, such information could ultimately can help protect satellites and spacecraft, as well as astronauts traveling to the Moon and Mars.

"Rosetta is the gift that keeps on giving," said Paul Feldman, an investigator on Alice at the Johns Hopkins University in Baltimore and a co-author of the paper. "The treasure trove of data it returned over its two-year visit to the comet have allowed us to rewrite the book on these most exotic inhabitants of our solar system -- and by all accounts there is much more to come."

NASA Instruments Aboard ESA's Rosetta

NASA-supplied instruments contributed to this investigation. The Ion and Electron Sensor (IES) instrument detected the amount and energy of electrons near the spacecraft, the Alice instrument measured the ultraviolet light emitted by the aurora, and the Microwave Instrument for the Rosetta Orbiter (MIRO) measured the amount of water molecules around the comet (the MIRO instrument includes contributions from France, Germany, and Taiwan). Other instruments aboard the spacecraft used in the research were the Italian Space Agency's Visible and InfraRed Thermal Imaging Spectrometer (VIRTIS), the Langmuir Probe (LAP) provided by Sweden, and the Rosetta Orbiter Spectrometer for Ion and Neutral Analysis (ROSINA) provided by Switzerland.

Rosetta was an ESA mission with contributions from its member states and NASA. Rosetta's Philae lander, which successfully landed on the comet in November 2014, was provided by a consortium led by the German Aerospace Center in Cologne; Max Planck Institute for Solar System Research in Gottingen, Germany; the French National Space Agency in, Paris; and the Italian Space Agency in Rome. A division of Caltech, NASA's Jet Propulsion Laboratory in Southern California managed the U.S. contribution of the Rosetta mission for NASA's Science Mission Directorate in Washington. JPL also built the MIRO and hosts its principal investigator, Mark Hofstadter. The Southwest Research Institute (San Antonio and Boulder, Colorado), developed the Rosetta orbiter's IES and Alice instruments and hosts their principal investigators, James Burch (IES) and Joel Parker (Alice)


Validating the physics behind the new fusion experiment

Inside a nuclear fusion reactor, concept illustration

Two and a half years ago, MIT entered into a research agreement with startup company Commonwealth Fusion Systems to develop a next-generation fusion research experiment, called SPARC, as a precursor to a practical, emissions-free power plant.

Now, after many months of intensive research and engineering work, the researchers charged with defining and refining the physics behind the ambitious reactor design have published a series of papers summarizing the progress they have made and outlining the key research questions SPARC will enable.

Overall, says Martin Greenwald, deputy director of MIT's Plasma Science and Fusion Center and one of the project's lead scientists, the work is progressing smoothly and on track. This series of papers provides a high level of confidence in the plasma physics and the performance predictions for SPARC, he says. No unexpected impediments or surprises have shown up, and the remaining challenges appear to be manageable. This sets a solid basis for the device's operation once constructed, according to Greenwald.

Greenwald wrote the introduction for a set of seven research papers authored by 47 researchers from 12 institutions and published today in a special issue of the Journal of Plasma Physics. Together, the papers outline the theoretical and empirical physics basis for the new fusion system, which the consortium expects to start building next year.

SPARC is planned to be the first experimental device ever to achieve a "burning plasma" -- that is, a self-sustaining fusion reaction in which different isotopes of the element hydrogen fuse together to form helium, without the need for any further input of energy. Studying the behavior of this burning plasma -- something never before seen on Earth in a controlled fashion -- is seen as crucial information for developing the next step, a working prototype of a practical, power-generating power plant.

Such fusion power plants might significantly reduce greenhouse gas emissions from the power-generation sector, one of the major sources of these emissions globally. The MIT and CFS project is one of the largest privately funded research and development projects ever undertaken in the fusion field.

The SPARC design, though about the twice the size as MIT's now-retired Alcator C-Mod experiment and similar to several other research fusion reactors currently in operation, would be far more powerful, achieving fusion performance comparable to that expected in the much larger ITER reactor being built in France by an international consortium. The high power in a small size is made possible by advances in superconducting magnets that allow for a much stronger magnetic field to confine the hot plasma.

The SPARC project was launched in early 2018, and work on its first stage, the development of the superconducting magnets that would allow smaller fusion systems to be built, has been proceeding apace. The new set of papers represents the first time that the underlying physics basis for the SPARC machine has been outlined in detail in peer-reviewed publications. The seven papers explore the specific areas of the physics that had to be further refined, and that still require ongoing research to pin down the final elements of the machine design and the operating procedures and tests that will be involved as work progresses toward the power plant.

The papers also describe the use of calculations and simulation tools for the design of SPARC, which have been tested against many experiments around the world. The authors used cutting-edge simulations, run on powerful supercomputers, that have been developed to aid the design of ITER. The large multi-institutional team of researchers represented in the new set of papers aimed to bring the best consensus tools to the SPARC machine design to increase confidence it will achieve its mission.

The analysis done so far shows that the planned fusion energy output of the SPARC reactor should be able to meet the design specifications with a comfortable margin to spare. It is designed to achieve a Q factor -- a key parameter denoting the efficiency of a fusion plasma -- of at least 2, essentially meaning that twice as much fusion energy is produced as the amount of energy pumped in to generate the reaction. That would be the first time a fusion plasma of any kind has produced more energy than it consumed.

The calculations at this point show that SPARC could actually achieve a Q ratio of 10 or more, according to the new papers. While Greenwald cautions that the team wants to be careful not to overpromise, and much work remains, the results so far indicate that the project will at least achieve its goals, and specifically will meet its key objective of producing a burning plasma, wherein the self-heating dominates the energy balance.

Limitations imposed by the Covid-19 pandemic slowed progress a bit, but not much, he says, and the researchers are back in the labs under new operating guidelines.

Overall, "we're still aiming for a start of construction in roughly June of '21," Greenwald says. "The physics effort is well-integrated with the engineering design. What we're trying to do is put the project on the firmest possible physics basis, so that we're confident about how it's going to perform, and then to provide guidance and answer questions for the engineering design as it proceeds."

Many of the fine details are still being worked out on the machine design, covering the best ways of getting energy and fuel into the device, getting the power out, dealing with any sudden thermal or power transients, and how and where to measure key parameters in order to monitor the machine's operation.

So far, there have been only minor changes to the overall design. The diameter of the reactor has been increased by about 12 percent, but little else has changed, Greenwald says. "There's always the question of a little more of this, a little less of that, and there's lots of things that weigh into that, engineering issues, mechanical stresses, thermal stresses, and there's also the physics -- how do you affect the performance of the machine?"

The publication of this special issue of the journal, he says, "represents a summary, a snapshot of the physics basis as it stands today." Though members of the team have discussed many aspects of it at physics meetings, "this is our first opportunity to tell our story, get it reviewed, get the stamp of approval, and put it out into the community."

Greenwald says there is still much to be learned about the physics of burning plasmas, and once this machine is up and running, key information can be gained that will help pave the way to commercial, power-producing fusion devices, whose fuel -- the hydrogen isotopes deuterium and tritium -- can be made available in virtually limitless supplies.

The details of the burning plasma "are really novel and important," he says. "The big mountain we have to get over is to understand this self-heated state of a plasma."

Hubble watches exploding star fade into oblivion

Astronomers using NASA's Hubble Space Telescope captured the quick, fading celebrity status of a supernova, the self-detonation of a star. The supernova, called SN 2018gv, appears in the lower left portion of the frame as a blazing star located on the outer edge of spiral galaxy NGC 2525, located 70 million light-years away.

 When a star unleashes as much energy in a matter of days as our Sun does in several billion years, you know it's not going to remain visible for long.

Like intergalactic paparazzi, NASA's Hubble Space Telescope captured the quick, fading celebrity status of a supernova, the self-detonation of a star. The Hubble snapshots have been assembled into a telling movie of the titanic stellar blast disappearing into oblivion in the spiral galaxy NGC 2525, located 70 million light-years away.

Hubble began observing SN 2018gv in February 2018, after the supernova was first detected by amateur astronomer Koichi Itagaki a few weeks earlier in mid-January. Hubble astronomers were using the supernova as part of a program to precisely measure the expansion rate of the universe -- a key value in understanding the physical underpinnings of the cosmos. The supernova serves as a milepost marker to measure galaxy distances, a fundamental value needed for measuring the expansion of space.

In the time-lapse sequence, spanning nearly a year, the supernova first appears as a blazing star located on the galaxy's outer edge. It initially outshines the brightest stars in the galaxy before fading out of sight.

"No Earthly fireworks display can compete with this supernova, captured in its fading glory by the Hubble Space Telescope," said Nobel laureate Adam Riess, of the Space Telescope Science Institute (STScI) and Johns Hopkins University in Baltimore, leader of the High-z Supernova Search Team and the Supernovae H0 for the Equation of State (SH0ES) Team to measure the universe's expansion rate.

The type of supernova seen in this sequence originated from a burned-out star -- a white dwarf located in a close binary system -- that is accreting material from its companion star. When the white dwarf reaches a critical mass, its core becomes hot enough to ignite nuclear fusion, turning it into a giant atomic bomb. This thermonuclear runaway process tears the dwarf apart. The opulence is short-lived as the fireball fades away.

Because supernovae of this type all peak at the same brightness, they are known as "standard candles," which act as cosmic tape measures. Knowing the actual brightness of the supernova and observing its brightness in the sky, astronomers can calculate the distances of their host galaxies. This allows astronomers to measure the expansion rate of the universe. Over the past 30 years Hubble has helped dramatically improve the precision of the universe's expansion rate.


Nobel Prize in Physics 2020: Discoveries about black holes

Abstract illustration of black hole


 The Royal Swedish Academy of Sciences has decided to award the Nobel Prize in Physics 2020 with one half to Roger Penrose, University of Oxford, UK, "for the discovery that black hole formation is a robust prediction of the general theory of relativity" and the other half jointly to Reinhard Genzel, Max Planck Institute for Extraterrestrial Physics, Garching, Germany and University of California, Berkeley, USA and Andrea Ghez, University of California, Los Angeles, USA "for the discovery of a supermassive compact object at the centre of our galaxy."

Black holes and the Milky Way's darkest secret

Three Laureates share this year's Nobel Prize in Physics for their discoveries about one of the most exotic phenomena in the universe, the black hole. Roger Penrose showed that the general theory of relativity leads to the formation of black holes. Reinhard Genzel and Andrea Ghez discovered that an invisible and extremely heavy object governs the orbits of stars at the centre of our galaxy. A supermassive black hole is the only currently known explanation.

Roger Penrose used ingenious mathematical methods in his proof that black holes are a direct consequence of Albert Einstein's general theory of relativity. Einstein did not himself believe that black holes really exist, these super-heavyweight monsters that capture everything that enters them. Nothing can escape, not even light.

In January 1965, ten years after Einstein's death, Roger Penrose proved that black holes really can form and described them in detail; at their heart, black holes hide a singularity in which all the known laws of nature cease. His groundbreaking article is still regarded as the most important contribution to the general theory of relativity since Einstein.

Reinhard Genzel and Andrea Ghez each lead a group of astronomers that, since the early 1990s, has focused on a region called Sagittarius A* at the centre of our galaxy. The orbits of the brightest stars closest to the middle of the Milky Way have been mapped with increasing precision. The measurements of these two groups agree, with both finding an extremely heavy, invisible object that pulls on the jumble of stars, causing them to rush around at dizzying speeds. Around four million solar masses are packed together in a region no larger than our solar system.

Using the world's largest telescopes, Genzel and Ghez developed methods to see through the huge clouds of interstellar gas and dust to the centre of the Milky Way. Stretching the limits of technology, they refined new techniques to compensate for distortions caused by the Earth's atmosphere, building unique instruments and committing themselves to long-term research. Their pioneering work has given us the most convincing evidence yet of a supermassive black hole at the centre of the Milky Way.

"The discoveries of this year's Laureates have broken new ground in the study of compact and supermassive objects. But these exotic objects still pose many questions that beg for answers and motivate future research. Not only questions about their inner structure, but also questions about how to test our theory of gravity under the extreme conditions in the immediate vicinity of a black hole," says David Haviland, chair of the Nobel Committee for Physics.

Tuesday, 6 October 2020

How coronavirus took hold in North America and in Europe

Global spread of coronavirus

 A new study combines evolutionary genomics from coronavirus samples with computer-simulated epidemics and detailed travel records to reconstruct the spread of coronavirus across the world in unprecedented detail.

Published in the journal Science, the results suggest an extended period of missed opportunity when intensive testing and contact tracing might have prevented SARS-CoV-2 from becoming established in North America and Europe.

The paper also challenges suggestions that linked the earliest known cases of COVID-19 on each continent in January to outbreaks detected weeks later, and provides valuable insights that could inform public health response and help with anticipating and preventing future outbreaks of COVID-19 and other zoonotic diseases.

"Our aspiration was to develop and apply powerful new technology to conduct a definitive analysis of how the pandemic unfolded in space and time, across the globe," said University of Arizona researcher Michael Worobey, who led an interdisciplinary team of scientists from 13 research institutions in the U.S., Belgium, Canada and the U.K. "Before, there were lots of possibilities floating around in a mish-mash of science, social media and an unprecedented number of preprint publications still awaiting peer review."

The team based their analysis on results from viral genome sequencing efforts, which began immediately after the virus was identified. These efforts quickly grew into a worldwide effort unprecedented in scale and pace and have yielded tens of thousands of genome sequences, publicly available in databases.

Contrary to widespread narratives, the first documented arrivals of infected individuals traveling from China to the U.S. and Europe did not snowball into continental outbreaks, the researchers found.

Instead, swift and decisive measures aimed at tracing and containing those initial incursions of the virus were successful and should serve as model responses directing future actions and policies by governments and public health agencies, the study's authors conclude.

How the Virus Arrived in the U.S. and Europe

A Chinese national flying into Seattle from Wuhan, China on Jan. 15 became the first patient in the U.S. shown to be infected with the novel coronavirus and the first to have a SARS-CoV-2 genome sequenced. This patient was designated 'WA1.' It was not until six weeks later that several additional cases were detected in Washington state.

"And while all that time goes past, everyone is in the dark and wondering, 'What's happening?'" Worobey said. "We hope we're OK, we hope there are no other cases, and then it becomes clear, from a remarkable community viral sampling program in Seattle, that there are more cases in Washington and they are genetically very similar to WA1's virus."

Worobey and his collaborators tested the prevailing hypothesis suggesting that patient WA1 had established a transmission cluster that went undetected for six weeks. Although the genomes sampled in February and March share similarities with WA1, they are different enough that the idea of WA1 establishing the ensuing outbreak is very unlikely, they determined. The researchers' findings indicate that the jump from China to the U.S. likely occurred on or around Feb. 1 instead.

The results also puts to rest speculation that this outbreak, the earliest substantial transmission cluster in the U.S., may have been initiated indirectly by dispersal of the virus from China to British Columbia, Canada, just north of Washington State, and then spread from Canada to the U.S. Multiple SARS-CoV-2 genomes published by the British Columbia Center for Disease Control appeared to be ancestral to the viral variants sampled in Washington State, strongly suggesting a Canadian origin of the U.S. epidemic. However, the present study revealed sequencing errors in those genomes, thus ruling out this scenario.

Instead, the new study implicates a direct-from-China source of the U.S. outbreak, right around the time the U.S. administration implemented a travel ban for travelers from China in early February. The nationality of the "index case" of the U.S. outbreak cannot be known for certain because tens of thousands of U.S. citizens and visa holders traveled from China to the U.S. even after the ban took effect.

A similar scenario marks the first known introduction of coronavirus into Europe. On Jan. 20, an employee of an automotive supply company in Bavaria, Germany, flew in for a business meeting from Shanghai, China, unknowingly carrying the virus, ultimately leading to infection of 16 co-workers. In that case, too, an impressive response of rapid testing and isolation prevented the outbreak from spreading any further, the study concludes. Contrary to speculation, this German outbreak was not the source of the outbreak in Northern Italy that eventually spread widely across Europe and eventually to New York City and the rest of the U.S.

The authors also show that this China-to-Italy-US dispersal route ignited transmission clusters on the East Coast slightly later in February than the China-to-US movement of the virus that established the Washington State outbreak. The Washington transmission cluster also predated small clusters of community transmission in February in California, making it the earliest anywhere in North America.

Early Containment Works

The authors say intensive interventions, involving testing, contact tracing, isolation measures and a high degree of compliance of infected individuals, who reported their symptoms to health authorities and self-isolated in a timely manner, helped Germany and the Seattle area contain those outbreaks in January.

"We believe that those measures resulted in a situation where the first sparks could successfully be stamped out, preventing further spread into the community," Worobey said. "What this tells us is that the measures taken in those cases are highly effective and should serve as a blueprint for future responses to emerging diseases that have the potential to escalate into worldwide pandemics."

To reconstruct the pandemic's unfolding, the scientists ran computer programs that carefully simulated the epidemiology and evolution of the virus, in other words, how SARS-CoV-2 spread and mutated over time.

"This allowed us to re-run the tape of how the epidemic unfolded, over and over again, and then check the scenarios that emerge in the simulations against the patterns we see in reality," Worobey said.

"In the Washington case, we can ask, 'What if that patient WA1 who arrived in the U.S. on Jan. 15 really did start that outbreak?' Well, if he did, and you re-run that epidemic over and over and over, and then sample infected patients from that epidemic and evolve the virus in that way, do you get a pattern that looks like what we see in reality? And the answer was no," he said.

"If you seed that early Italian outbreak with the one in Germany, do you see the pattern that you get in the evolutionary data? And the answer, again, is no," he said.

"By re-running the introduction of SARS-CoV-2 into the U.S. and Europe through simulations, we showed that it was very unlikely that the first documented viral introductions into these locales led to productive transmission clusters," said co-author Joel Wertheim of the University of California, San Diego. "Molecular epidemiological analyses are incredibly powerful for revealing transmissions patterns of SARS-CoV-2."

Other methods were then combined with the data from the virtual epidemics, yielding exceptionally detailed and quantitative results.

"Fundamental to this work stands our new tool combining detailed travel history information and phylogenetics, which produces a sort of 'family tree' of how the different genomes of virus sampled from infected individuals are related to each other," said co-author Marc Suchard of the University of California, Los Angeles. "The more accurate evolutionary reconstructions from these tools provide a critical step to understand how SARS-CoV-2 spread globally in such a short time."

"We have to keep in mind that we have studied only short-term evolution of this virus, so it hasn't had much time to accumulate many mutations," said co-author Philippe Lemey of the University of Leuven, Belgium. "Add to that the uneven sampling of genomes from different parts of the world, and it becomes clear that there are huge benefits to be gained from integrating various sources of information, combining genomic reconstructions with complementary approaches like flight records and the total number of COVID-19 cases in various global regions in January and February."


Some severe COVID-19 cases linked to genetic mutations or antibodies that attack the body

Coronavirus illustration 

 People infected by the novel coronavirus can have symptoms that range from mild to deadly. Now, two new analyses suggest that some life-threatening cases can be traced to weak spots in patients' immune systems.

At least 3.5 percent of study patients with severe COVID-19, the disease caused by the novel coronavirus, have mutations in genes involved in antiviral defense. And at least 10 percent of patients with severe disease create "auto-antibodies" that attack the immune system, instead of fighting the virus. The results, reported in two papers in the journal Science on September 24, 2020, identify some root causes of life-threatening COVID-19, says study leader Jean-Laurent Casanova, a Howard Hughes Medical Institute Investigator at The Rockefeller University.

Seeing these harmful antibodies in so many patients -- 101 out of 987 -- was "a stunning observation," he says. "These two papers provide the first explanation for why COVID-19 can be so severe in some people, while most others infected by the same virus are okay."

The work has immediate implications for diagnostics and treatment, Casanova says. If someone tests positive for the virus, they should "absolutely" be tested for the auto-antibodies, too, he adds, "with medical follow-up if those tests are positive." It's possible that removing such antibodies from the blood could ease symptoms of the disease.

A global effort

Casanova's team, in collaboration with clinicians around the world, first began enrolling COVID-19 patients in their study in February. At the time, they were seeking young people with severe forms of the disease to investigate whether these patients might have underlying weaknesses in their immune systems that made them especially vulnerable to the virus.

The plan was to scan patients' genomes -- in particular, a set of 13 genes involved in interferon immunity against influenza. In healthy people, interferon molecules act as the body's security system. They detect invading viruses and bacteria and sound the alarm, which brings other immune defenders to the scene.

Casanova's team has previously discovered genetic mutations that hinder interferon production and function. People with these mutations are more vulnerable to certain pathogens, including those that cause influenza. Finding similar mutations in people with COVID-19, the team thought, could help doctors identify patients at risk of developing severe forms of the disease. It could also point to new directions for treatment, he says.

In March, Casanova's team was aiming to enroll 500 patients with severe COVID-19 worldwide in their study. By August, they had more than 1,500, and they now have over 3,000. As the researchers began analyzing patient samples, they started to uncover harmful mutations, in people young and old. The team found that 23 out of 659 patients studied carried errors in genes involved in producing antiviral interferons.

Without a full complement of these antiviral defenders, COVID-19 patients wouldn't be able to fend off the virus, the researchers suspected. That thought sparked a new idea. Maybe other patients with severe COVID-19 also lacked interferons -- but for a different reason. Maybe some patients' bodies were harming these molecules themselves. As in autoimmune disorders such as type 1 diabetes and rheumatoid arthritis, some patients might be making antibodies that target the body. "That was the eureka moment for us," Casanova says.

The team's analysis of 987 patients with life-threatening COVID-19 revealed just that. At least 101 of the patients had auto-antibodies against an assortment of interferon proteins. "We said, 'bingo'!" Casanova remembers. These antibodies blocked interferon action and were not present in patients with mild COVID-19 cases, the researchers discovered.

"It's an unprecedented finding," says study co-author Isabelle Meyts, a pediatrician at the University Hospitals KU Leuven, in Belgium, who earlier this year helped enroll patients in the study, gather samples, and perform experiments. By testing for the presence of these antibodies, she says, "you can almost predict who will become severely ill."

The vast majority -- 94 percent -- of patients with the harmful antibodies were men, the team found. Men are more likely to develop severe forms of COVID-19, and this work offers one explanation for that gender variability, Meyts says.

Casanova's lab is now looking for the genetic driver behind those auto-antibodies. They could be linked to mutations on the X chromosome, he says. Such mutations might not affect women, because they have a second X chromosome to compensate for any defects in the first. But for men, who carry only a single X, even small genetic errors can be consequential.


Can the common cold help protect you from COVID-19?

Sick with a cold, 

Seasonal colds are by all accounts no fun, but new research suggests the colds you've had in the past may provide some protection from COVID-19. The study, authored by infectious disease experts at the University of Rochester Medical Center, also suggests that immunity to COVID-19 is likely to last a long time -- maybe even a lifetime.

The study, published in mBio, is the first to show that the COVID-19-causing virus, SARS-CoV-2, induces memory B cells, long-lived immune cells that detect pathogens, create antibodies to destroy them and remember them for the future. The next time that pathogen tries to enter the body, those memory B cells can hop into action even faster to clear the infection before it starts.

Because memory B cells can survive for decades, they could protect COVID-19 survivors from subsequent infections for a long time, but further research will have to bear that out.

The study is also the first to report cross-reactivity of memory B cells -- meaning B cells that once attacked cold-causing coronaviruses appeared to also recognize SARS-CoV-2. Study authors believe this could mean that anyone who has been infected by a common coronavirus -- which is nearly everyone -- may have some degree of pre-existing immunity to COVID-19.

"When we looked at blood samples from people who were recovering from COVID-19, it looked like many of them had a pre-existing pool of memory B cells that could recognize SARS-CoV-2 and rapidly produce antibodies that could attack it," said lead study author Mark Sangster, Ph.D., research professor of Microbiology and Immunology at URMC.

Sangster's findings are based on a comparison of blood samples from 26 people who were recovering from mild to moderate COVID-19 and 21 healthy donors whose samples were collected six to 10 years ago -- long before they could have been exposed to COVID-19. From those samples, study authors measured levels of memory B cells and antibodies that target specific parts of the Spike protein, which exists in all coronaviruses and is crucial for helping the viruses infect cells.

The Spike protein looks and acts a little different in each coronavirus, but one of its components, the S2 subunit, stays pretty much the same across all of the viruses. Memory B cells can't tell the difference between the Spike S2 subunits of the different coronaviruses, and attack indiscriminately. At least, the study found that was true for betacoronaviruses, a subclass that includes two cold-causing viruses as well as SARS, MERS and SARS-CoV-2.

Nobel Prize in Physiology or Medicine 2020: Discovery of Hepatitis C virus

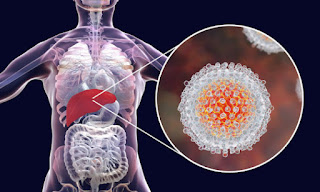
Hepatitis C virus infection medical concept, 3D illustration 

 The Nobel Assembly at Karolinska Institutet has today decided to award the 2020 Nobel Prize in Physiology or Medicine jointly to Harvey J. Alter, Michael Houghton and Charles M. Rice for the discovery of Hepatitis C virus.

This year's Nobel Prize is awarded to three scientists who have made a decisive contribution to the fight against blood-borne hepatitis, a major global health problem that causes cirrhosis and liver cancer in people around the world.

Harvey J. Alter, Michael Houghton and Charles M. Rice made seminal discoveries that led to the identification of a novel virus, Hepatitis C virus. Prior to their work, the discovery of the Hepatitis A and B viruses had been critical steps forward, but the majority of blood-borne hepatitis cases remained unexplained. The discovery of Hepatitis C virus revealed the cause of the remaining cases of chronic hepatitis and made possible blood tests and new medicines that have saved millions of lives.

Hepatitis -- a global threat to human health

Liver inflammation, or hepatitis, a combination of the Greek words for liver and inflammation, is mainly caused by viral infections, although alcohol abuse, environmental toxins and autoimmune disease are also important causes. In the 1940's, it became clear that there are two main types of infectious hepatitis. The first, named hepatitis A, is transmitted by polluted water or food and generally has little long-term impact on the patient. The second type is transmitted through blood and bodily fluids and represents a much more serious threat since it can lead to a chronic condition, with the development of cirrhosis and liver cancer. This form of hepatitis is insidious, as otherwise healthy individuals can be silently infected for many years before serious complications arise. Blood-borne hepatitis is associated with significant morbidity and mortality, and causes more than a million deaths per year world-wide, thus making it a global health concern on a scale comparable to HIV-infection and tuberculosis.

An unknown infectious agent

The key to successful intervention against infectious diseases is to identify the causative agent. In the 1960's, Baruch Blumberg determined that one form of blood-borne hepatitis was caused by a virus that became known as Hepatitis B virus, and the discovery led to the development of diagnostic tests and an effective vaccine. Blumberg was awarded the Nobel Prize in Physiology or Medicine in 1976 for this discovery.

At that time, Harvey J. Alter at the US National Institutes of Health was studying the occurrence of hepatitis in patients who had received blood transfusions. Although blood tests for the newly-discovered Hepatitis B virus reduced the number of cases of transfusion-related hepatitis, Alter and colleagues worryingly demonstrated that a large number of cases remained. Tests for Hepatitis A virus infection were also developed around this time, and it became clear that Hepatitis A was not the cause of these unexplained cases.

It was a great source of concern that a significant number of those receiving blood transfusions developed chronic hepatitis due to an unknown infectious agent. Alter and his colleagues showed that blood from these hepatitis patients could transmit the disease to chimpanzees, the only susceptible host besides humans. Subsequent studies also demonstrated that the unknown infectious agent had the characteristics of a virus. Alter's methodical investigations had in this way defined a new, distinct form of chronic viral hepatitis. The mysterious illness became known as "non-A, non-B" hepatitis.

Identification of Hepatitis C virus

Identification of the novel virus was now a high priority. All the traditional techniques for virus hunting were put to use but, in spite of this, the virus eluded isolation for over a decade. Michael Houghton, working for the pharmaceutical firm Chiron, undertook the arduous work needed to isolate the genetic sequence of the virus. Houghton and his co-workers created a collection of DNA fragments from nucleic acids found in the blood of an infected chimpanzee. The majority of these fragments came from the genome of the chimpanzee itself, but the researchers predicted that some would be derived from the unknown virus. On the assumption that antibodies against the virus would be present in blood taken from hepatitis patients, the investigators used patient sera to identify cloned viral DNA fragments encoding viral proteins. Following a comprehensive search, one positive clone was found. Further work showed that this clone was derived from a novel RNA virus belonging to the Flavivirus family and it was named Hepatitis C virus. The presence of antibodies in chronic hepatitis patients strongly implicated this virus as the missing agent.

The discovery of Hepatitis C virus was decisive; but one essential piece of the puzzle was missing: could the virus alone cause hepatitis? To answer this question the scientists had to investigate if the cloned virus was able to replicate and cause disease. Charles M. Rice, a researcher at Washington University in St. Louis, along with other groups working with RNA viruses, noted a previously uncharacterized region in the end of the Hepatitis C virus genome that they suspected could be important for virus replication. Rice also observed genetic variations in isolated virus samples and hypothesized that some of them might hinder virus replication. Through genetic engineering, Rice generated an RNA variant of Hepatitis C virus that included the newly defined region of the viral genome and was devoid of the inactivating genetic variations. When this RNA was injected into the liver of chimpanzees, virus was detected in the blood and pathological changes resembling those seen in humans with the chronic disease were observed. This was the final proof that Hepatitis C virus alone could cause the unexplained cases of transfusion-mediated hepatitis.

Significance of this Nobel Prize-awarded discovery

The Nobel Laureates' discovery of Hepatitis C virus is a landmark achievement in the ongoing battle against viral diseases. Thanks to their discovery, highly sensitive blood tests for the virus are now available and these have essentially eliminated post-transfusion hepatitis in many parts of the world, greatly improving global health. Their discovery also allowed the rapid development of antiviral drugs directed at hepatitis C. For the first time in history, the disease can now be cured, raising hopes of eradicating Hepatitis C virus from the world population. To achieve this goal, international efforts facilitating blood testing and making antiviral drugs available across the globe will be required.

Harvey J. Alter was born in 1935 in New York. He received his medical degree at the University of Rochester Medical School, and trained in internal medicine at Strong Memorial Hospital and at the University Hospitals of Seattle. In 1961, he joined the National Institutes of Health (NIH) as a clinical associate. He spent several years at Georgetown University before returning to NIH in 1969 to join the Clinical Center's Department of Transfusion Medicine as a senior investigator.

Michael Houghton was born in the United Kingdom. He received his PhD degree in 1977 from King's College London. He joined G. D. Searle & Company before moving to Chiron Corporation, Emeryville, California in 1982. He relocated to University of Alberta in 2010 and is currently a Canada Excellence Research Chair in Virology and the Li Ka Shing Professor of Virology at the University of Alberta where he is also Director of the Li Ka Shing Applied Virology Institute.

Charles M. Rice was born in 1952 in Sacramento. He received his PhD degree in 1981 from the California Institute of Technology where he also trained as a postdoctoral fellow between 1981-1985. He established his research group at Washington University School of Medicine, St Louis in 1986 and became full Professor in 1995. Since 2001 he has been Professor at the Rockefeller University, New York. During 2001-2018 he was the Scientific and Executive Director, Center for the Study of Hepatitis C at Rockefeller University where he remains active.

Saturday, 15 August 2020

Explainer: What are logarithms and exponents?


Logarithms are mathematical relationships used to compare things that can vary dramatically in scale.


When COVID-19 hit the United States, the numbers just seemed to explode. First, there were only one or two cases. Then there were 10. Then 100. Then thousands and then hundreds of thousands. Increases like this are hard to understand. But exponents and logarithms can help make sense of those dramatic increases.

Scientists often describe trends that increase very dramatically as being exponential. It means that things don’t increase (or decrease) at a steady pace or rate. It means the rate changes at some increasing pace.

An example is the decibel scale, which measures sound pressure level. It is one way to describe the strength of a sound wave. It’s not quite the same thing as loudness, in terms of human hearing, but it’s close. For every 10 decibel increase, the sound pressure increases 10 times. So a 20 decibel sound has not twice the sound pressure of 10 decibels, but 10 times that level. And the sound pressure level of a 50 decibel noise is 10,000 times greater than a 10-decibel whisper (because you’ve multiplied 10 x 10 x 10 x 10).

An exponent is a number that tells you how many times to multiply some base number by itself. In that example above, the base is 10. So using exponents, you could say that 50 decibels is 104 times as loud as 10 decibels. Exponents are shown as a superscript — a little number to the upper right of the base number. And that little 4 means you’re to multiply 10 times itself four times. Again, it’s 10 x 10 x 10 x 10 (or 10,000).

Logarithms are the inverse of exponents. A logarithm (or log) is the mathematical expression used to answer the question: How many times must one “base” number be multiplied by itself to get some other particular number?

For instance, how many times must a base of 10 be multiplied by itself to get 1,000? The answer is 3 (1,000 = 10 × 10 × 10). So the logarithm base 10 of 1,000 is 3. It’s written using a subscript (small number) to the lower right of the base number. So the statement would be log10(1,000) = 3.

At first, the idea of a logarithm might seem unfamiliar. But you probably already think logarithmically about numbers. You just don’t realize it.

Let’s think about how many digits a number has. The number 100 is 10 times as big as the number 10, but it only has one more digit. The number 1,000,000 is 100,000 times as big as 10, but it only has five more digits. The number of digits a number has grows logarithmically. And thinking about numbers also shows why logarithms can be useful for displaying data. Can you imagine if every time you wrote the number 1,000,000 you had to write down a million tally marks? You’d be there all week! But the “place value system” we use allows us to write down numbers in a much more efficient way.

Why describe things as logs and exponents?

Log scales can be useful because some types of human perception are logarithmic. In the case of sound, we perceive a conversation in a noisy room (60 dB) to be just a bit louder than a conversation in a quiet room (50 dB). Yet the sound pressure level of voices in the noisy room might be 10 times higher.

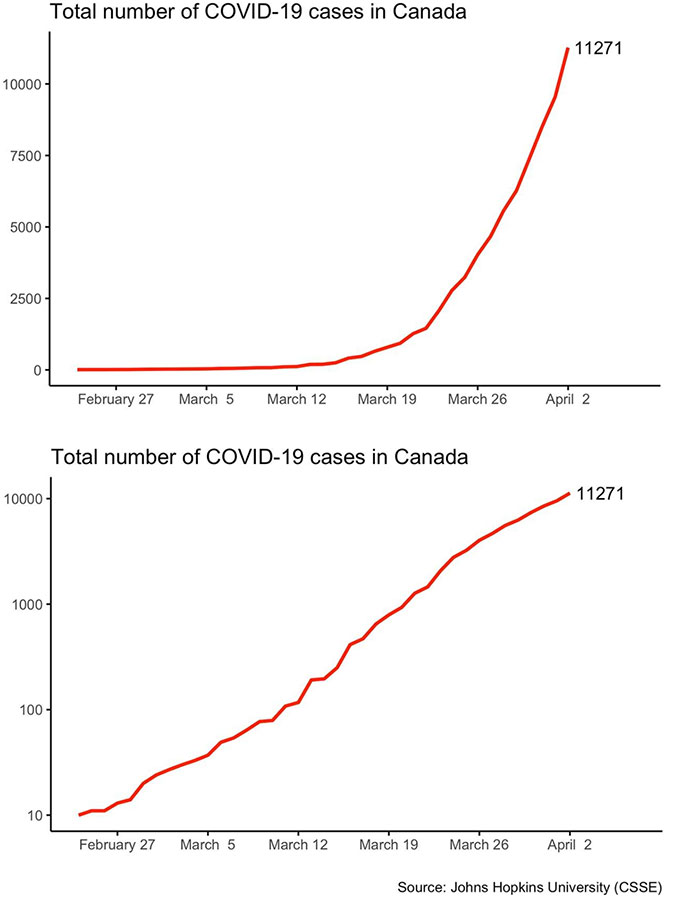
a linear graph and a log graph
These graphs plot the same information, but show it somewhat differently. The plot at left is linear, the one at right is logarithmic. The steep curve in the left plot looks flatter on the right plot.CANADIAN JOURNAL OF POLITICAL SCIENCE, APR. 14, 2020, PP.1–6/ (CC BY 4.0)

Another reason to use a log scale is that it allows scientists to show data easily. It would be hard to fit the 10 million lines on a sheet of graph paper that would be needed to plot the differences from a quiet whisper (30 decibels) to the sound of a jackhammer (100 decibels). But they’ll easily fit on a page using a scale that’s logarithmic. It’s also an easy way to see and understand big changes such as rates of growth (for a puppy, a tree or a country’s economy). Any time you see the phrase “order of magnitude,” you’re seeing a reference to a logarithm.

Logarithms have many uses in science. pH — the measure of how acidic or basic a solution is — is logarithmic. So is the Richter scale for measuring earthquake strength.

In 2020, the term logarithmic became best known to the public for its use in describing the spread of the new pandemic corona virus (SARS-CoV-2). As long as each person who got infected spread the virus to no more than one other person, the size of the infection would stay the same or die out. But if the number was more than 1, it would increase “exponentially” — which means that a logarithmic scale could be useful to graph it.

Basic bases

The base number of a logarithm can be almost any number. But there are three bases which are especially common for science and other uses.

  1. Binary logarithm: This is a logarithm where the base number is two. Binary logarithms are the basis for the binary numeral system, which allows people to count using only the numbers zero and one. Binary logarithms are important in computer science. They’re also used in music theory. A binary logarithm describes the number of octaves between two musical notes.
  2. Natural logarithm: A so-called “natural” logarithm — written ln — is used in many areas of math and science. Here the base number is an irrational number referred to as e, or Euler’s number. (The mathematician Leonhard Euler did not intend to name it after himself. He was writing a math paper using letters to represent numbers and happened to use e for this number.) That e is about 2.72 (though you can never write it down completely in decimals). The number e has some very special mathematical properties that make it useful in many areas of math and science, including chemistry, economics (the study of wealth) and statistics. Researchers also have used the natural logarithm to define the curve that describes how a dog’s age relates to a human one.
  3. Common logarithm: This is a logarithm where the base number is 10. This is the logarithm used in measurements for sound, pH, electricity and light.

Novel C. diff structures are required for infection, offer new therapeutic targets

  Iron storage "spheres" inside the bacterium C. diff -- the leading cause of hospital-acquired infections -- could offer new targ...